Features of ThermalOne
While various architectural thermal environment simulation software programs have been developed for different applications and purposes, the main features that distinguish ThermalOne include the following:
1. High-Precision Mathematical Model for Coupled Heat and Moisture Analysis
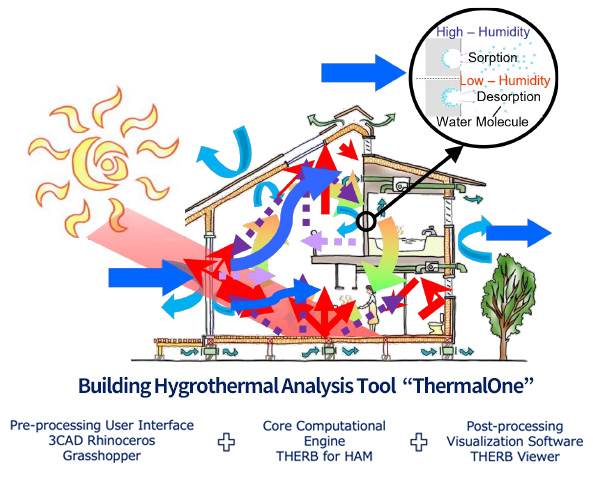
The THERB for HAM model, adopted as the engine, is a mathematical model developed to reproduce actual physical phenomena with high precision, such as the transfer of heat, moisture, and air. It also supports detailed calculations, including the moisture absorption and desorption of the building envelope. As there are growing concerns about rising temperatures and increased atmospheric water vapor due to global warming, the importance of analysis that includes moisture is expected to increase further. The ability to flexibly adapt to such environmental changes is a major strength of this model.
2. Highly Extensible User Interface
Because ThermalOne utilizes Rhinoceros and Grasshopper for its user interface, it is possible to transition seamlessly into simulations while referencing pre-existing models. Additionally, these tools have a large global user base, and numerous add-on applications for Grasshopper continue to be developed. By utilizing these in tandem, users can achieve highly extensible applications.
3. Highly Flexible Simulation for All Shapes and Specifications
While many simulation tools require complex shapes to be divided into rectangular solids for simulation, ThermalOne supports polyhedrons with up to 100 sides, enabling the highly precise reproduction of organic shapes. Moreover, because the analysis engine employs a calculation model based on physical phenomena, it can flexibly accommodate advanced technologies and specifications in addition to a wide range of buildings, from residential homes to commercial buildings.
ThermalOne Viewer
Room temp and Humidity
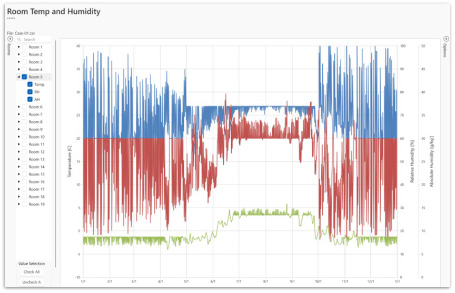
Changes over time in room temperature, relative humidity, absolute humidity and surface temperature of building structures in any given room. This is useful for monitoring and evaluating trends, peaks and differences between rooms in the indoor environment over the course of a year or any specified period.
BoxPlot
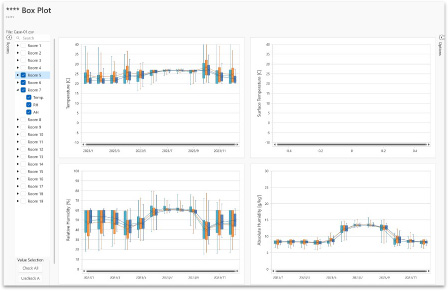
Monthly box-and-whisker plots of room temperature, relative humidity, absolute humidity and building envelope surface temperature for any room. These plots visualise the monthly distribution (mean, median and range) of room temperature, relative humidity and absolute humidity for the whole year or any specified period.
Heating and Cooling
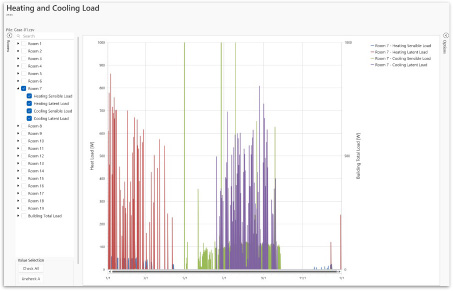
Changes over time in the heating load (sensible and latent heat) and cooling load (sensible and latent heat) for any given room. This is useful for checking and evaluating trends, peaks and differences between rooms in heating and cooling loads on an annual basis or for any specified period.
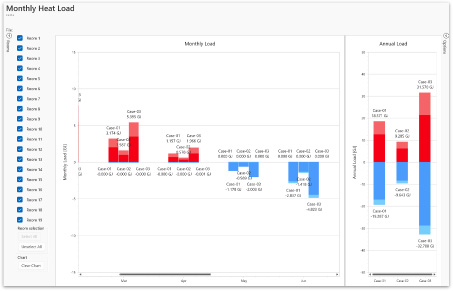
Monthly Heat Load
Monthly and annual cumulative heating loads (sensible and latent heat) and cumulative cooling loads (sensible and latent heat) for any room. This is useful for evaluating heating and cooling loads for the entire building or on a room-by-room basis. It is also possible to compare and evaluate multiple scenarios based on different calculation conditions.
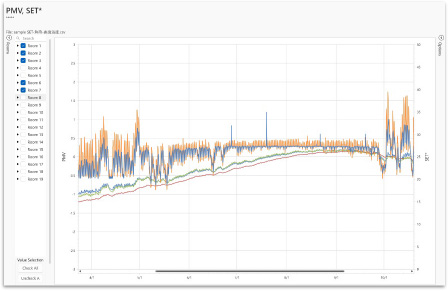
PMV SET*
Changes in PMV and SET* over time for any given room. This is useful for identifying trends in comfort levels by room over the course of a year or any specified period, as well as for identifying and evaluating differences between rooms.
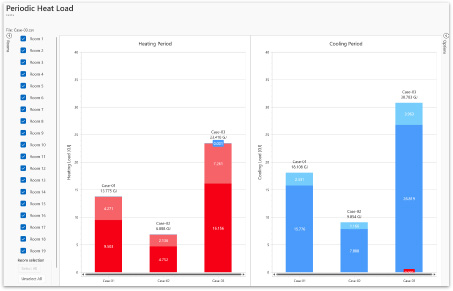
Periodic Heat Load
Total heating and cooling loads (sensible and latent heat) for any room during the heating and cooling seasons. Assessment of annual loads. Comparison and evaluation of multiple scenarios with different calculation conditions is also possible.
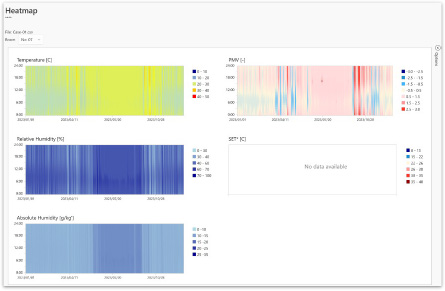
Heatmap
Annual heatmaps of room temperature, relative humidity, absolute humidity, PMV and SET* for any room. These visualise changes in indoor thermal comfort throughout the year.
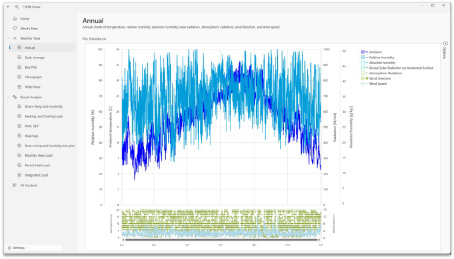
Annual
Time-series data on air temperature, relative humidity, absolute humidity, horizontal total solar radiation, atmospheric radiation, wind direction and wind speed. This enables the analysis of trends and characteristics in meteorological conditions over the course of a year or any specified period.
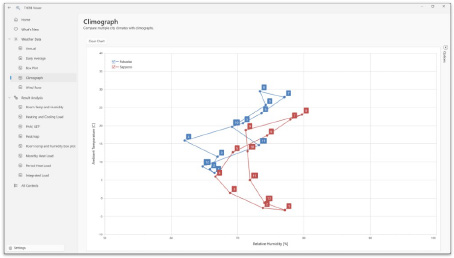
Climograph
We visualise the climatic characteristics of the construction site using a climatogram. This is useful for assessing the comfort levels of the area and considering factors relevant to building design. It also allows for comparisons of weather conditions with other regions.
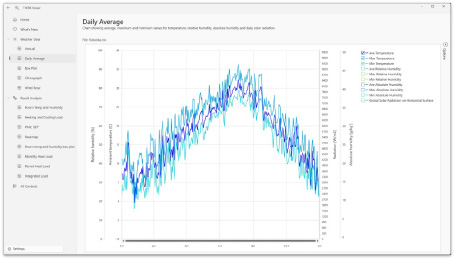
Daily Average
Annual variations in daily averages, daily maximum and minimum values for air temperature, relative humidity and absolute humidity, and the daily total of horizontal global solar radiation. This visualises typical daily weather conditions, allowing you to observe gradual changes in the climate.
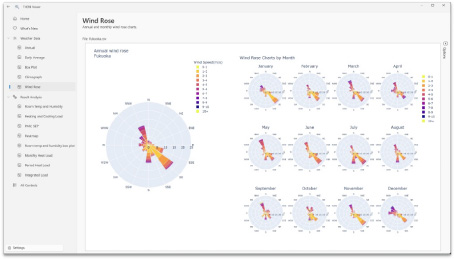
WindRose
Annual and monthly wind rose charts. These visualise the frequency of wind direction and wind speed at the construction site by compass direction.
BoxPlot
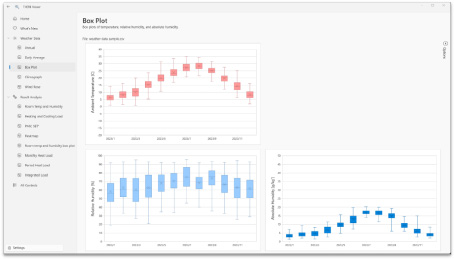
Monthly box-and-whisker plots of temperature, relative humidity and absolute humidity. These plots visualise the distribution of monthly temperature, relative humidity and absolute humidity (mean, median and range). They can be used to identify trends in weather conditions—such as monthly variations and maximum and minimum values that are not apparent from standard mean values alone—and to inform design considerations that take these factors into account.
In addition to the above, calculations are performed based on various theories, including solar radiation and general radiation calculations. For details on the theoretical aspects, please refer to the manuals and technical guides.”
How to use ThermalOne
To activate ThermalOne, a license key is required.
First, please complete the user registration process. Then, obtain your license key from the Pricing & Plans section on your My Page.
FAQ
Which version of Rhinoceros do I need to use?
Please use Rhinoceros 8 version 8SR12 or later.
Is it compatible with Mac?
Due to the limitations of the calculation programme, the supported operating system is currently Windows only
Related contents